

Anthropic's finances, illustrated (the S‑1 in six charts)

Andrei Gaspar
Anthropic reported an $80.748 billion net loss in the first half of 2026: $14.439 billion in Q1 and $66.309 billion in Q2. It recorded $16.286 billion in revenue over those six months. Every quarter shown in this article ended with a net loss.
There has been a lot of discussion recently around Anthropic and their upcoming IPO. I thought I'll create some charts to visualize and better understand the situation.
These charts use Anthropic's October 26 S-1. H1 means January through June. The interim and quarterly results shown here are unaudited. Dollar amounts are US dollars; $0.001 billion is $1 million. Tap any chart to open a version you can zoom. The source data are available as a CSV.
Revenue, operating results and net losses
Each quarter has four bars on one scale. Orange shows revenue. Black shows operating expenses as a positive amount for comparison; it is a cost, not income. The striped bar shows the operating result: revenue minus operating expenses, gray when positive and red when negative. The solid red bar shows the final net loss, after interest, financial-instrument valuation changes, other income or expense, and taxes. All negative bars are red.
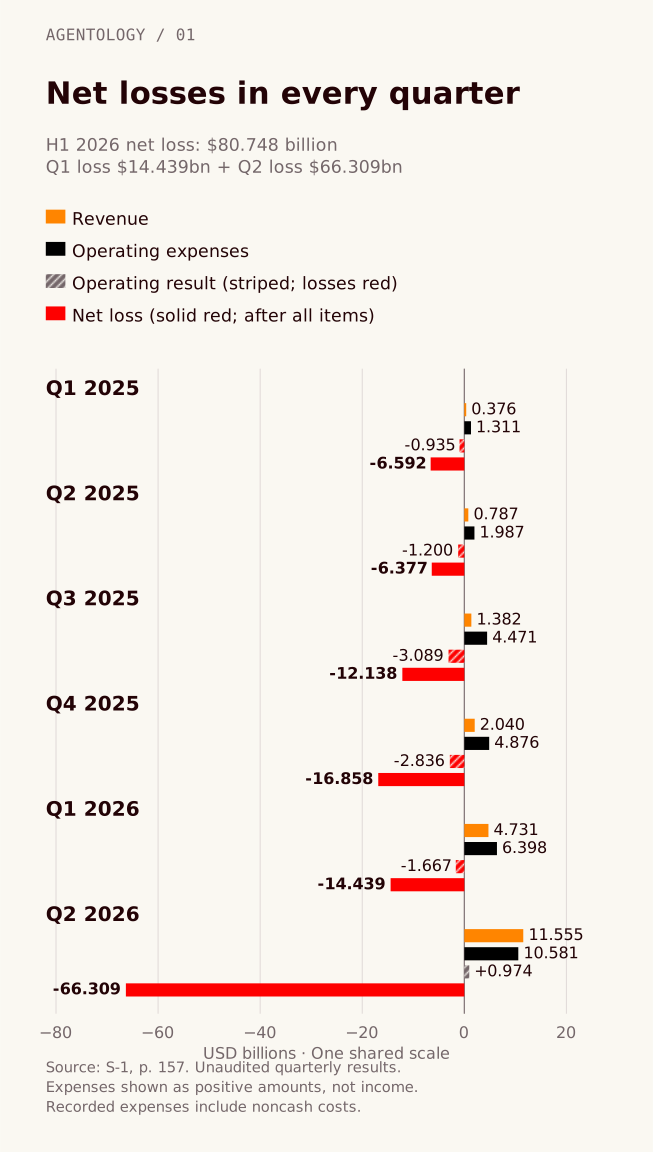
Source: S-1, quarterly results, p. 157. Open full-size chart (SVG).
Q2's $974 million of operating income is an intermediate result. After the remaining items, the quarter ends with a $66.309 billion net loss. The two numbers belong to the same quarter; the operating figure alone does not establish an overall profit.
| Period | Operating result | Net result |
|---|---|---|
| Q1 2026 | $1.667 billion loss | $14.439 billion loss |
| Q2 2026 | $0.974 billion income | $66.309 billion loss |
| H1 2026: Q1 + Q2 | $0.693 billion loss | $80.748 billion loss |
A quarter, a half-year and an annualized number answer different questions. Multiplying one quarter by four gives a pace, not a year of recorded sales. This chart keeps the reported quarters intact.
Put expenses beside $100 of revenue
An expense can grow in dollars while shrinking relative to sales. Dividing each expense by revenue lets both movements be read separately. The next chart compares January–June with January–June.
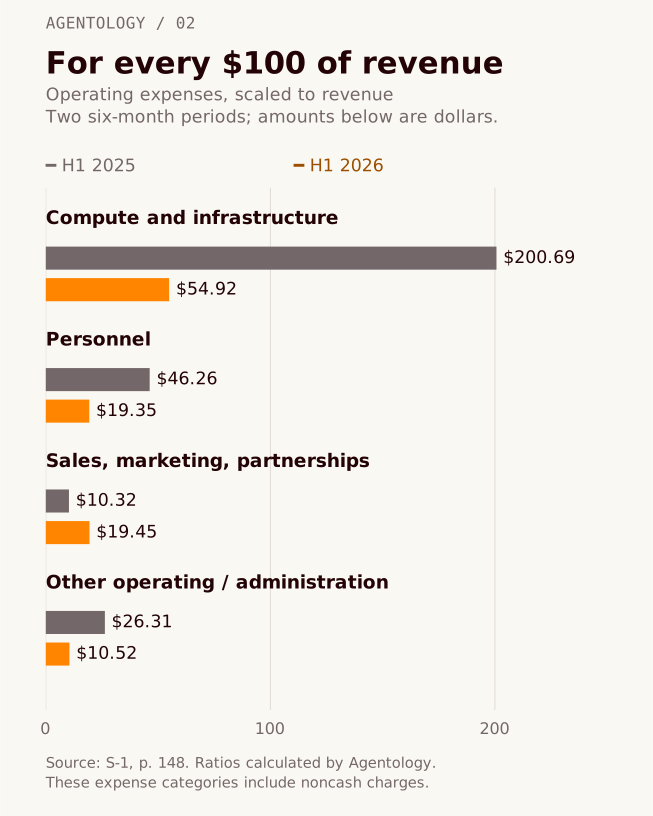
Source: S-1, p. 148; ratios calculated from the reported amounts. Open full-size chart (SVG).
Compute and infrastructure expense went from $2.334 billion to $8.945 billion. Revenue went from $1.163 billion to $16.286 billion. Those are the inputs to the first pair of bars.
The chart describes the whole company's expense categories. It cannot price an individual Claude request. A category can contain spending shared across many products, and an accounting expense can include items that do not require a cash payment that period.
Nor is the space left after the compute bar a gross margin. Subtracting one expense category from revenue leaves all the other expenses still to account for.
Sponsored:
What accounts for the $80.748 billion net loss
Two financial-instrument lines account for $81.108 billion in net noncash charges: $72.388 billion on the filing's convertible-notes, derivative-liabilities and SAFEs line, plus $8.720 billion for other instruments. The operating loss, interest income, remaining other expense and taxes bring the final net loss to $80.748 billion.
In this chart, red bars show the operating loss and items that reduce the running balance; orange shows interest income. The final red bar shows the net loss. Small changes retain their exact labels even when their bars nearly disappear at the shared scale.
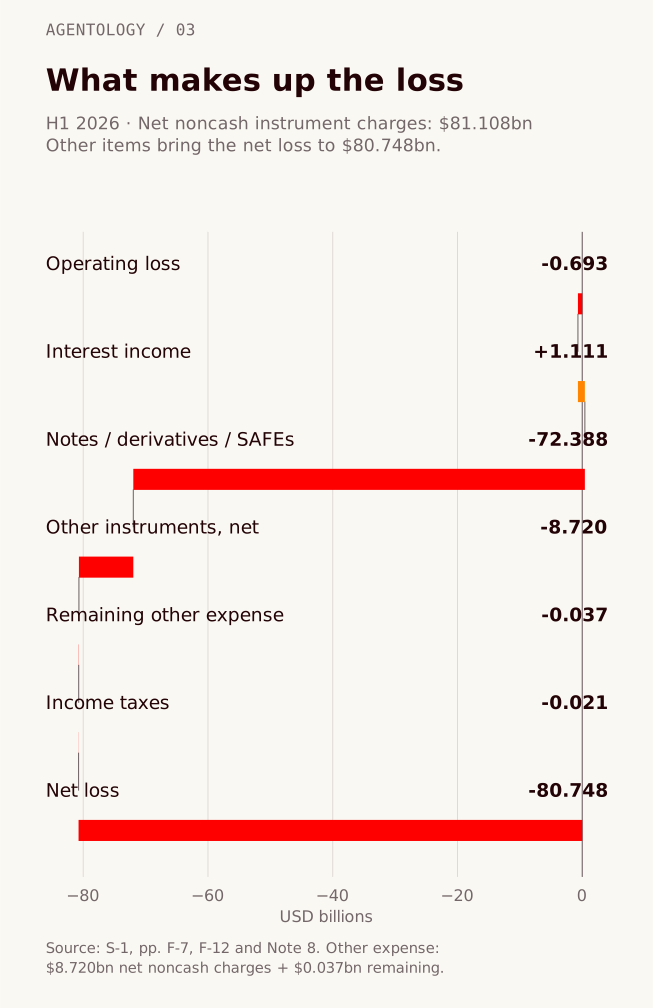
Sources: S-1, consolidated statements of operations, p. F-7; cash flows, p. F-12; and Note 8, Other Income (Expense), Net. The $8.757 billion of other expense comprises a net $8.720 billion of noncash instrument adjustments and $0.037 billion of remaining other expense. Open full-size chart (SVG).
A convertible note is financing that can turn into shares under agreed terms. Its accounting value can change after the original financing arrives. If the shares it can convert into become more valuable, the instrument can become more valuable to its holder. For the company that issued it, an increase in the recorded liability creates an expense when the instrument is measured at fair value.
Anthropic attributes the note-related valuation changes primarily to increases in its enterprise valuation. The chart retains the filing's label, which also names derivative liabilities and SAFEs, agreements for future equity. All SAFEs had converted by the end of 2024; their presence in the label does not imply a SAFE charge in 2026.
The second instrument amount, $8.720 billion, sits inside other expense and is a net charge. Note 8 breaks it into $9.405 billion of expense for note purchase agreements and $39 million for a holdback liability, offset by a $724 million gain on warrant rights. The cash-flow statement identifies the net adjustment as noncash. The chart counts it once.
These charges do not mean $81.108 billion left the bank account during those six months. They do count toward the reported net loss. When financing converts into shares, it can change existing shareholders' ownership percentages; whether and how it converts depends on the agreement. The accounting charge and the eventual cash or share settlement are separate events.
Follow the loss into the cash-flow statement
The cash-flow statement starts with net loss and reconciles it to cash from operations. Its noncash adjustments total $83.509 billion, leaving $2.761 billion before changes in operating assets and liabilities. The chart starts there, on a new scale. Red bars mark negative adjustments. The resulting $3.929 billion of operating cash flow measures cash movement; the reported net result remains an $80.748 billion loss.
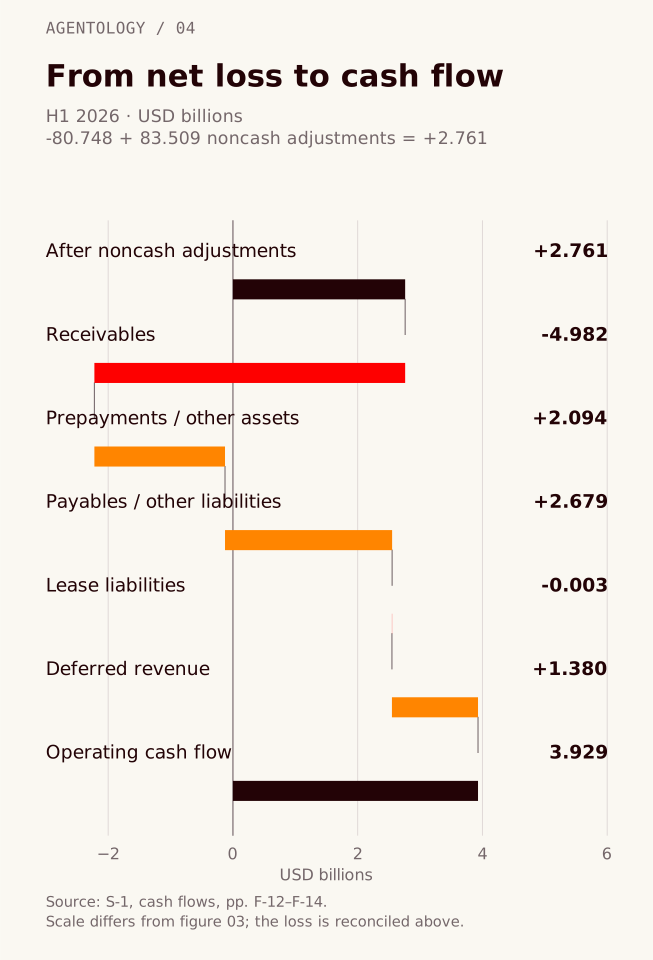
Source: S-1, consolidated statements of cash flows, pp. F-12–F-14. Open full-size chart (SVG).
Receivables arise when revenue has been recorded before payment arrives. Payables work in the other direction: a cost can be recorded before the supplier is paid. Customer advances can bring cash in before revenue is earned. Prepayments put the payment ahead of the expense.
Those timing differences explain why profit and operating cash flow need separate statements. A positive adjustment is an addition in the reconciliation, not necessarily a new cash receipt. Consuming a service paid for earlier, for example, reduces a prepaid asset without requiring the same payment again.
Subtracting $482 million of property-and-equipment purchases from operating cash flow yields $3.447 billion. That is an operating-cash-flow-minus-capital-expenditure calculation. It does not subtract every investing outflow or future contractual payment.
Financing also changes the cash balance
Red bars in the next chart mark cash outflows and negative adjustments. Operating cash flow is one route into the cash account. Issuing shares or borrowing brings in financing cash. Buying equipment or investments uses investing cash; selling or maturing investments can return it.
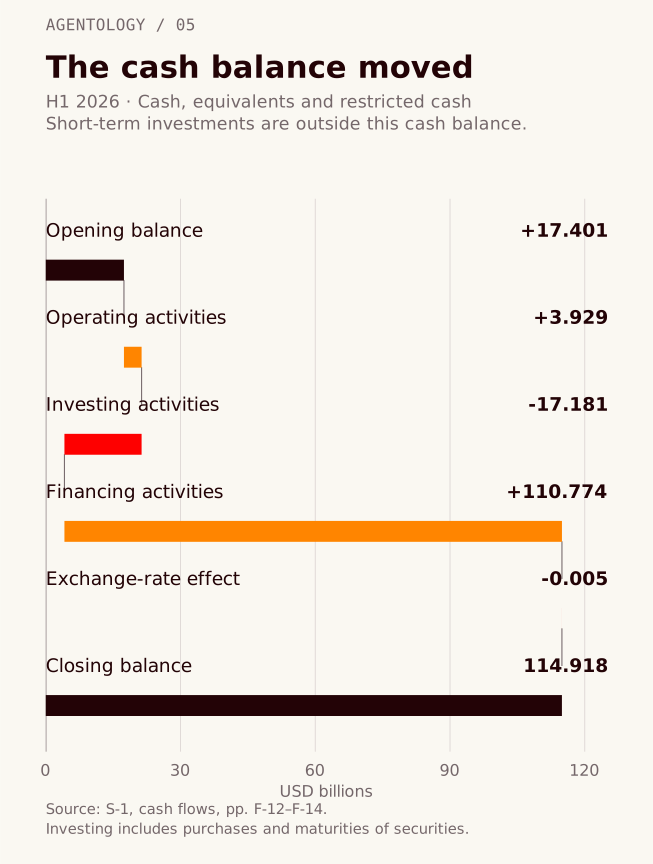
Source: S-1, consolidated statements of cash flows, pp. F-12–F-14. Open full-size chart (SVG).
This cash-flow balance includes restricted cash. A different, commonly quoted balance combines cash and equivalents with short-term investments:
| At June 30, 2026 | USD billions |
|---|---|
| Cash and equivalents | 112.389 |
| Short-term investments | 19.262 |
| Combined, calculated | 131.651 |
| Restricted cash, shown separately | 2.529 |
Source: S-1, consolidated balance sheets, p. F-5.
The table and chart use different boundaries. Short-term investments belong in the table's combined figure; restricted cash belongs in the chart's closing balance. Adding both headline balances together would count the same cash twice.
Compute commitments run on a longer calendar
A contract amount is a promise about future payments under specified terms. Comparing it with one quarter's expenses requires knowing when capacity arrives, when payment starts, and which conditions apply.
The final chart preserves the individual arrangements. Its figures cover different lengths of time and include agreements amended after the June balance-sheet date.
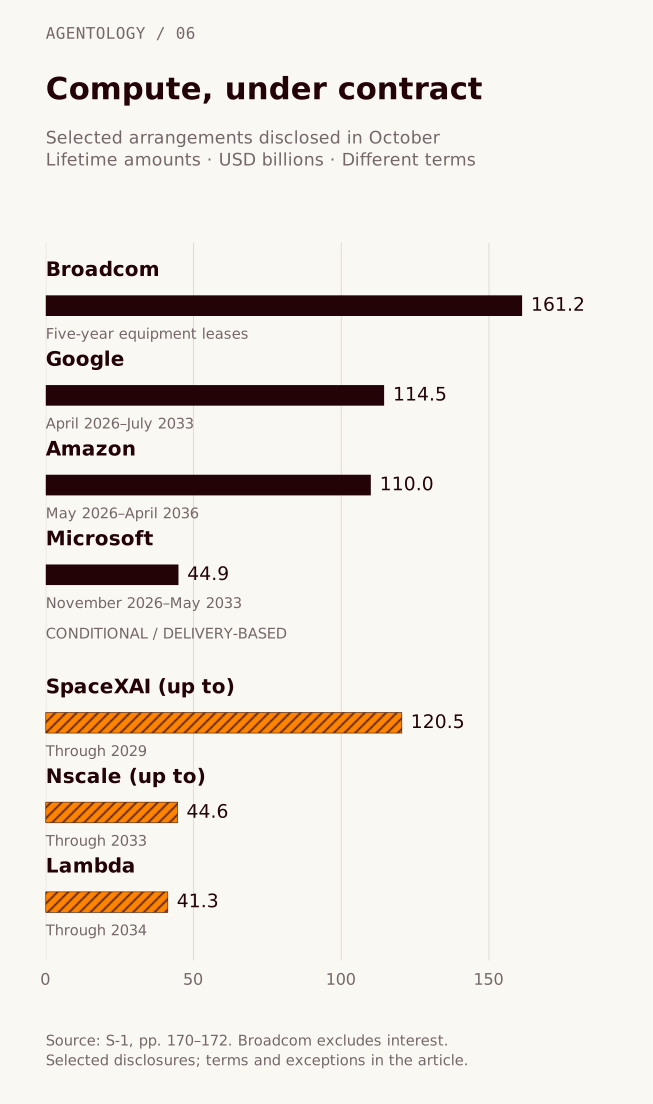
Source: S-1, infrastructure arrangements, pp. 170–172. Open full-size chart (SVG).
| Arrangement | How to read the amount |
|---|---|
| Broadcom | Approximate rent across five-year equipment leases, excluding interest. Payments generally start when equipment is ready for service, with exceptions. |
| Google, Amazon, Microsoft | Minimum spending regardless of actual usage, subject to contractual exceptions. The chart labels each spending window. |
| SpaceXAI | An upper amount. After initial non-cancelable periods end in January and March 2027, the respective agreements allow cancellation with 90 days' notice. |
| Nscale | Up to the stated amount. Fees accrue as capacity is delivered and accepted; financing, delivery and other contract conditions apply. |
| Lambda | Approximate amount. Fees accrue as capacity is delivered and accepted; termination rights include a facility-lease condition for one agreement. |
These selected arrangements are not a complete obligations schedule. The filing also describes additional TPU capacity and AMD systems with payments dependent on deployment and other conditions. The contract bars are not added to the cash-flow bars: they describe different periods, and a commitment can become an expense and a cash payment at different times.
For a particular number, keep its date and definition attached. Revenue covers a period. Cash is measured on a date. A contract extends across future dates. The unit may be dollars in each case; what those dollars measure changes from one chart to the next.
This blog exists thanks to the support of our sponsors:





Comments
Loading comments…